
Location |
60 miles SE of Danville Virginia |
Wind |
30 mph |
Heading |
NE at 12 mph |
Pressure |
29.71 |
Coordinates |
78.7W, 35.9N |
Suggested Videos
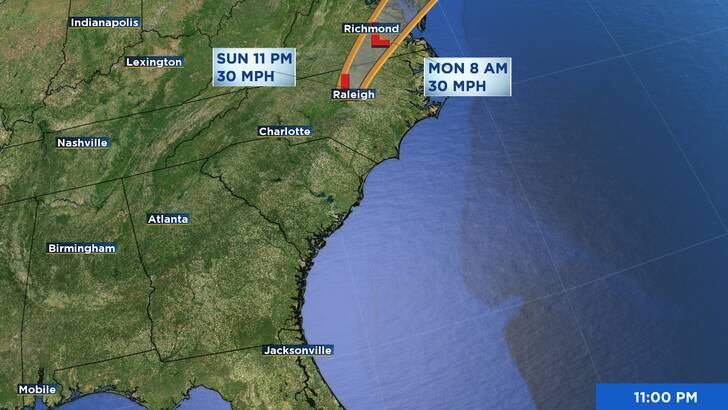
The center of Tropical Depression Chantal was situated close to latitude 35.9 North, longitude 78.7 West, around 1100 PM EDT (0300 UTC). The depression is currently traveling at around 12 mph (19 km/h) toward the northeast, and on Monday, it is anticipated that this motion will continue with an increase in forward speed.
With greater gusts, the maximum sustained winds are close to 30 mph (45 km/h). Over the next 48 hours, there should be little change in strength.
A minimum central pressure of 1006 mb (29.71 inches) is estimated.
* Central North Carolina * South-central Virginia are under flood watches.
The Tropical Cyclone Discussion’s AWIPS header MIATCDAT3 and WMO header WTNT43 KNHC provide the key messages for Tropical Depression Chantal.
Tropical Depression Rainfall Parts of northern North Carolina and Virginia will continue to experience significant rainfall on Sunday night and Monday due to Chantal. Rainfall is predicted to range from 3 to 6 inches overall, with local totals as high as 9 inches. Measurements of rainfall between Goldston, Burlington, and Caldwell, west of Durham, have been in the 7 to 8 inch range. Flash flooding is expected to remain at a high risk through Monday.
The National Weather Service Storm Total Rainfall Graphic, accessible at hurricanes.gov/graphics_at3.shtml?rainqpf, provides a comprehensive representation of the predicted rainfall and flash flooding linked to Tropical Depression Chantal.
See the companion storm summary at WBCSCCNS4 with the WMO header ACUS44 KWBC or click this link to view a list of rainfall observations (and wind reports) related to this storm: www.wpc.ncep.noaa.gov/discussions/nfdscc4.html
SURF: Over the course of the next day or so, beaches along the U.S. East coast, from northeastern Florida to the Mid-Atlantic states, are predicted to continue to experience life-threatening surf and rip current conditions.
Here is a graphic representation of the risk of rip currents in the United States: hurricanes.gov/graphics_at3.shtml?ripCurrents